


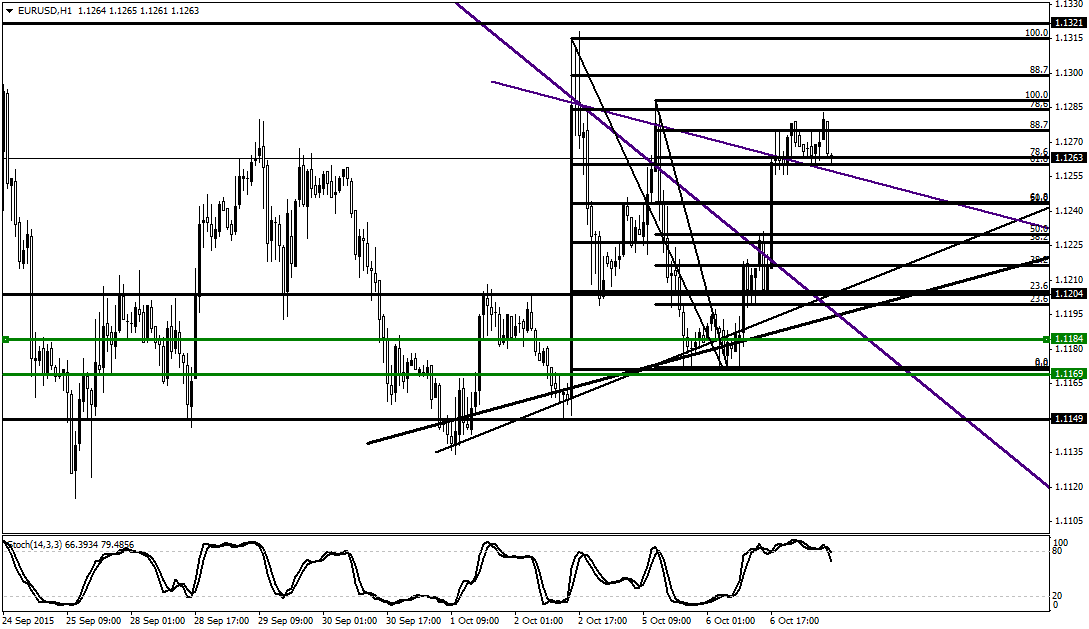
A long legged doji formed the confluence which is good enough reason to go Long. A buy order was triggered at 1.1184 with a Stop Loss at 1.1149 ( 34 pips) below a swing low which I profess is a safe haven since price would have to work its way through the trend lines and the cluster to get to it; and Target at 1.1321 (138 pips). A trailing stop --34 pips -- was set.Liquidity has dried out in this pair owing to that it is past its session, so I expect price to break downward into the PRZ after which it may begin to rally.
Price level 1.12064 had held price different times in the past and could serve as a resistance now. Likewise, 4-Hour trend line and 1-Hour trend line (thick and thin Indigo lines respectively) could act as resistance.
EVENTUALLY
As I predicted, price dipped into the Potential Reversal Zone and as a result formed a bullish divergence and rallied. It broke the 1.1204 resistance level and came back for a retest indicating that a resistance had turned into a support. I flawed somewhat in this trade in that I completely omitted the Fibonacci Retracement tools in my analysis while considering levels that could bounce price against me -- perhaps a testament to that I am yet to get back into rhythm after a lengthy break (though I doubt that).
When price bounced off the trend line from 4-Hour time frame (thick indigo line), the bounce was hindered by support level at 1.1204 after which price resumed its upward move. When it tested the 1-Hour trend line (thin indigo line), Dojis formed. That spot is a confluence between the Fibonacci cluster and the 1-Hour trend. I was wary of that position. But I had to wait for formation of a Market Structure High (MSH), so I waited (in accordance to my Exit Rules).
It never did form. After, price broke through the trend line and aimed higher. I exited the trade after Stochastic signaled a bearish divergence. This is in line with my third Exit Rule; and it proved priceless owing to that price declined heavily as if pulled by gravity.
Profit/Loss: + 77 pips
0 comments:
Post a Comment